
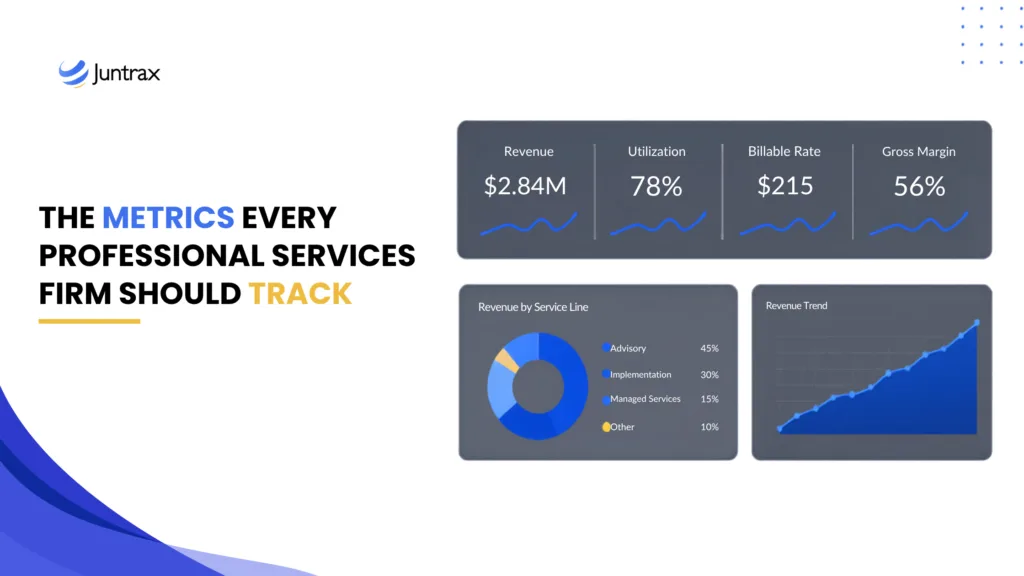
Most professional services firms are busier than they have ever been and less sure than ever whether the work is paying off. Headcount is up, projects ship, and yet margin stays flat. The professional services metrics that would explain the gap exist inside every firm, buried in timesheets, invoices, and project files that rarely meet in one place. According to SPI Research’s 2026 Professional Services Maturity Benchmark, which draws on 509 organizations managing roughly 63 billion dollars in services revenue, billable utilization fell to 66.4 percent in 2025, the lowest reading in the study’s history. This guide covers the metrics that move a service business, the formulas behind them, and the reason so many firms still measure them badly.
Why Most Professional Services Firms Track the Wrong Metrics
Before listing what to measure, it helps to understand why measurement is so hard to get right. The problem is rarely a shortage of data. It is a shortage of clean, agreed, connected data.
Three things break first.
Definitions drift: Ask five partners what utilization means, and you can easily get five answers, one counting holidays, one excluding them, one blending billable and non-billable time. Without a shared definition, every report starts from a different place.
Time entry slips: Utilization and realization live and die on accurate timekeeping, so when people log hours in a rush at month-end, the numbers turn into noise.
Systems sit in silos: Project management lives in one tool, billing in another, and payroll and expenses somewhere else again. Pulling a single clean view means manual reconciliation that most teams never have time to finish.
There is a fourth, quieter problem. Many firms track only lagging metrics, the ones that report what already happened, such as last quarter’s margin. Lagging numbers are useful for the record, but they cannot warn you in time to change the outcome. A firm that watches only closed-project margin finds out about a bad engagement long after the cost is locked in.
For firms across India and the GCC, where a 25 to 150 person services team often runs projects across several currencies and legal entities, these gaps compound faster. The Asia Pacific region is the fastest-growing market for professional services automation software, expanding at a 16.8 percent compound annual rate according to Grand View Research, which means more firms are scaling into exactly this complexity every year.
The Core Metrics Every Professional Services Firm Should Track
A useful metric set is small. It tells you whether people are busy, whether busy work turns into billed revenue, whether that revenue turns into profit, and whether the cash arrives on time. The seven below cover that full path from work performed to money collected.
| Metric | What It Measures | Simple Formula | Healthy Reference |
| Billable Utilization | Share of available time spent on billable work | Billable hours / Total available hours | Above 70 percent (SPI benchmark) |
| Realization Rate | Share of billable value you invoice | Invoiced value / Standard value of hours worked | Higher is better; watch write-offs |
| Project Margin | Profit left after direct delivery cost | (Project revenue minus direct cost) / Project revenue | Above 35 percent (SPI benchmark) |
| Revenue per Billable Employee | Revenue each biller generates | Total revenue / Number of billable staff | Trend upward over time |
| Days Sales Outstanding | How long cash stays tied up in receivables | (Accounts receivable / Credit revenue) times days | Lower is better |
| Project Overrun | How far projects run past budget | (Actual cost minus budgeted cost) / Budgeted cost | Below 10 percent (SPI benchmark) |
| Client Health | Whether your client base is deepening or weakening | Retention, net revenue retention, NPS | Stable to rising |
Billable Utilization Rate
Utilization is the percentage of a person’s available time spent on billable client work. It sits close to the center of a services business because when it drops, revenue, staffing plans, and margin all move with it. SPI Research puts the healthy benchmark above 70 percent, and the fall to 66.4 percent in 2025 is why utilization is the number most leaders are watching right now.
One caution matters more than the target itself. The goal is profitable utilization, not maximum utilization. A senior expert spending 60 percent of their time on premium advisory work often earns the firm more than a junior billing 90 percent at commodity rates. Set role-specific targets by working backward from your gross margin goal, rather than applying one flat number to everyone.
Realization Rate
Utilization tells you people are busy. Realization tells you whether that busyness became money. It compares what you invoiced against the standard value of the hours worked. When realization is soft, the cause is usually revenue leakage: write-offs, scope creep the client never paid for, discounting, or billing that slipped through the cracks. A firm can run high utilization and still bleed profit if realization is weak, which is why the two numbers belong side by side.
Project Margin
Every engagement needs to be measured financially, and project margin is where that lands. It is the revenue left after the direct cost of delivery, expressed as a percentage. SPI Research’s benchmark target sits above 35 percent. Margin is famously hard to control at the project level because it depends on time, seniority mix, materials, and billing rules all resolving correctly at once. That difficulty is exactly why it needs a live view rather than a spreadsheet assembled after the fact.
Revenue per Billable Employee
This metric divides total revenue by the number of billable staff, and it reflects how effectively a firm turns its largest investment, its people, into income. The single reading matters less than the trend and the comparison across service lines. A rising figure suggests pricing and utilization are working together. A flat one over several quarters is a signal to look at rates, staffing, or the mix of work.
Days Sales Outstanding
A project can finish with a healthy margin on paper and still leave the firm short of cash if the invoice sits unpaid for 90 days. Days Sales Outstanding measures how long revenue stays locked in receivables before it becomes usable cash. For project-driven SMEs, where payroll and vendor payments do not wait, DSO is often the difference between growth and a cash crunch. Read it alongside margin: a strong margin with a climbing DSO points to a client who may be a growth risk long before renewal talks begin.
Project Overrun
Overrun tracks how far a project runs past its budgeted cost or hours. SPI Research’s benchmark keeps overrun below 10 percent. Rising overrun usually points to loose scoping, weak change control, or estimates that were optimistic from the start. Because it ties directly to both client satisfaction and profitability, catching an overrun mid-project, while there is still room to correct, is worth far more than reporting it once the engagement closes.
Client Health
Past margin cannot tell you whether the next quarter will be easier or harder. Client health metrics can. The three metrics worth watching are client retention, net revenue retention, and Net Promoter Score. Together, they show whether your existing base is getting deeper, flatter, or weaker. A project can close with a decent margin and still damage an account through messy delivery, so client health acts as the leading indicator that pure financial metrics miss. Backlog and pipeline coverage sit alongside this as forward views: they show whether committed future work matches the capacity you are carrying.
Leading vs Lagging Metrics: Reading Them Together
Strong operators do not treat utilization, realization, margin, cash timing, and client health as separate scorecards. They read the distance between them, because the gaps are where the story lives.
If consultants are busy but realization is soft, the issue is pricing, scope control, or how time gets classified. If the realization looks healthy but the margin is weak, the problem is delivery cost or seniority mix. If the margin is fine on paper but cash is late, the client may be a growth risk. Reading the numbers together tells a leader whether the firm has a capacity problem, a commercial problem, or an execution problem, and those three call for very different fixes. That diagnostic only works when the underlying data comes from the same connected source, so the numbers are comparable in the first place.
Why These Metrics Break Down Without Connected Systems
Here is where most measurement efforts fall apart. Utilization comes from timesheets, realization and margin come from billing, cash timing comes from receivables, and payroll cost sits in HR. When those live in separate tools, producing one honest dashboard means exporting, matching, and reconciling by hand every month, and the answer arrives too late to act on.
Juntrax closes that gap. It is the unified PSA, HRMS, and cash-flow platform that acts as the project-to-cash operations layer for project-driven SMEs, so timesheets, projects, rate cards, invoicing, and receivables sit in one place, and the metrics above calculate themselves in real time. It works alongside your existing accounting system rather than replacing it: Juntrax handles the project, time, and invoicing data, then syncs the journal entries to Tally, QuickBooks, Xero, or SAP, so your accountant keeps the ledger they already trust. For engineering services firms and similar project-based teams, that means every billable hour has a clear path from the timesheet to the invoice, and the leak becomes visible before it costs a quarter of the margin.
How to Start Tracking Professional Services Metrics
A metrics program fails when it tries to measure everything at once. The firms that get value from it share a few habits.
Start small. Begin with five to eight metrics and track them well before expanding, because tracking a few numbers accurately beats tracking twenty poorly. Standardize definitions. Write down exactly how each metric is calculated and where its data comes from, so utilization means the same thing in every report. Set a review cadence. Most operational metrics warrant a monthly look, while strategic ones such as pipeline health and client retention can be reviewed quarterly. Assign ownership. Every metric needs a named owner who is accountable for the number and empowered to act on it; otherwise, the dashboard becomes wallpaper. The rhythm and the ownership matter as much as the metrics themselves.
Turning Metrics Into Decisions
The professional services metrics that matter are not exotic. Utilization, realization, margin, revenue per employee, DSO, overrun, and client health have described the health of services firms for years. What separates the firms that improve from the ones that stall is not a longer list of numbers. It is clean definitions, connected data, and the discipline to read the metrics against each other so the gaps point to a decision. Get that foundation in place, and the same seven numbers that once explained the past start to shape the next quarter instead.
Frequently Asked Questions
What Are the Most Important Metrics for a Professional Services Firm?
The core set is billable utilization, realization rate, project margin, revenue per billable employee, days sales outstanding, project overrun, and client health. Together, they trace the full path from work performed to cash collected, which is why a firm gains more from these seven read together than from a longer list read in isolation.
What Is a Good Billable Utilization Rate?
SPI Research puts the healthy benchmark above 70 percent, and its 2026 study recorded an industry low of 66.4 percent. The right target is role-specific, though. Work backward from your gross margin goal to find the utilization each role needs, rather than applying one number across the whole team.
What Is the Difference Between Utilization and Realization?
Utilization measures how much of a person’s available time went to billable work. Realization measures how much of that billable value you invoiced and collected. High utilization with low realization is a classic warning sign: the team is busy, but scope creep, write-offs, or billing delays are eating into the revenue before it reaches the invoice.
How Many Metrics Should a Professional Services Firm Track?
Most firms find that five to eight core metrics give enough insight without overwhelming decision-makers. Start focused, standardize how each one is measured, and expand only once the core set is reliable and owned.
Why Do Professional Services Firms Struggle to Track Metrics?
The usual causes are inconsistent definitions, poor time-entry discipline, and disconnected systems. When project management, billing, and finance data live in separate tools, producing one accurate report takes manual reconciliation that rarely happens on time, so leaders end up deciding on stale or conflicting numbers.