Table of Contents
- What Is Project Tracking Software?
- Why Project Tracking Software Matters: The Numbers
- The Five Phases of a Project — and Where Tracking Fits
- Signs Your Current Tracking Approach Is Failing
- Core Features of Project Tracking Software
- Project Tracking Views: Which One Does Your Team Need?
- The KPIs Your Project Tracking Software Should Measure
- A Framework for Project Tracking: The Iron Triangle + One
- Project Tracking Template
- How to Choose the Right Project Tracking Software
- How to Implement Project Tracking Software: A Practical Roadmap
- Common Mistakes When Setting Up Project Tracking
- Project Tracking in Different Contexts
- The Role of AI in Project Tracking (2026)
- Conclusion
- Frequently Asked Questions
You’re three weeks into a six-week project. The team is busy. Status updates are trickling in via Slack. Someone just told you a key task is “nearly done,” but they said that last week, too. A client is asking for a progress report by end of day.
If that sounds familiar, you’re running into the exact problem that project tracking software exists to solve. The team isn’t slacking. The work is happening. But nobody has a clear, shared, real-time picture of where things actually stand.
PMI’s latest research puts the global project success rate at around 48-50%, depending on how you measure it. Under the traditional scope/budget/schedule lens, some studies peg it even lower, around 35%. Either way, roughly half of all projects miss their targets. Organisations waste roughly 12% of every dollar invested in projects due to poor performance. That’s money that disappears because plans and reality drift apart, and nobody catches it in time.
Project tracking software is how you close that gap.
This guide covers what project tracking software is, how it works, what features matter, which KPIs to track, how to choose the right tool for your team, and how to implement it properly. There’s a free template at the end you can use straight away.
What Is Project Tracking Software?
Project tracking software is a digital tool that gives you real-time visibility into a project’s progress against its planned timeline, budget, and scope. It answers the four questions every stakeholder asks constantly:
- Are we on time?
- Are we on budget?
- Is the scope under control?
- Who is doing what, and are there any blockers?
It sits within the broader project management lifecycle, specifically in the monitoring and control phase. That phase runs in parallel with execution, from kickoff to closure. During it, project tracking software gives managers and team leads the data they need to spot problems early, make informed decisions, and keep stakeholders aligned.
Project Tracking vs. Project Management Software: What’s the Difference?
These terms get used interchangeably all the time, but there’s a meaningful distinction:
| Aspect | Project Management Software | Project Tracking Software |
|---|---|---|
| Primary focus | Planning, scheduling, resource allocation | Monitoring progress, status, and performance |
| When it’s used most | Before and during project initiation | During execution through to closure |
| Core output | Project plan, resource assignments | Status reports, progress dashboards, variance alerts |
| Key question | How do we set this up? | How are we doing against the plan? |

In practice, most modern platforms do both. But the tracking layer, the ability to compare planned vs. actual, flag delays, and surface risks, is what delivers value during execution. That’s what this guide focuses on.
What Project Tracking Is Not
- Not just time tracking. Time tracking captures hours worked. Project tracking uses that data (among other inputs) to assess whether a project is on schedule and on budget.
- Not just task management. Task management assigns work and marks it done. Project tracking tells you what those completions mean for the overall plan.
- Not a status meeting. Status meetings are a symptom of poor tracking. When project tracking works properly, everyone already knows the status before the meeting starts.
Why Project Tracking Software Matters: The Numbers
The business case for proper project tracking is backed by data.
- Roughly half of projects globally are considered successful, with 13% rated as outright failures and the rest falling into a grey zone. Under the traditional triple-constraint lens (on time, on budget, within scope), some industry studies put the success rate as low as 35%.
- Research found that organisations collectively waste around $1 million every 20 seconds globally due to poor project management practices, driven by poor planning, misaligned goals, and insufficient monitoring.
- 45% of project managers spend more than one day per week manually reporting status updates. That’s time that should be spent managing, not compiling spreadsheets. Projects without formal change management processes are 35% more likely to exceed costs or miss deadlines.
- 58% of professional services teams now use three to five separate tools to manage their work. That fragmentation is exactly where tracking breaks down: status lives in one tool, budgets in another, resource capacity in a spreadsheet nobody updates.
- The project management software market is projected to grow from $11.27 billion in 2026 to $23.09 billion by 2031, a 15.4% CAGR driven primarily by demand for real-time collaboration and performance tracking.
The market is growing because the problem is growing. More projects, more distributed teams, more complexity, and more pressure to deliver on time and on budget.
The Five Phases of a Project (and Where Tracking Fits)
Understanding where tracking sits in the project lifecycle helps clarify what the software actually needs to do.
1. Initiation
Define the project, gain approval, establish goals and success criteria. Tracking software plays a minor role here; the focus is on getting the baseline right.
2. Planning
Create the schedule, assign resources, define tasks and dependencies, establish the budget baseline. This is where you set the benchmarks your tracking will measure against.
3. Execution
Work begins. Teams complete tasks, consume budget, and progress toward milestones. Tracking becomes the primary management activity.
4. Monitoring and Control
This is tracking’s home. Compare actual progress against the plan. Identify variance. Adjust timelines, resources, and scope where necessary. Flag risks. Update stakeholders.
5. Closure
Finalise deliverables, conduct retrospectives, archive project data for future reference. Good tracking data from the project becomes the foundation for better estimates on the next one.
Most features in project tracking software are designed to make steps 4 and 5 happen automatically, so you don’t have to do them manually.
Signs Your Current Tracking Approach Is Failing
Before looking at what good looks like, here are the patterns that signal your current approach isn’t working:
You find out about delays when they’ve already happened. If the team tells you something slipped after it slipped, your tracking is retrospective rather than preventative.
Status updates come from people, not from a system. Spending meetings going around the room asking “where are you with X?” means you don’t have real-time visibility. The data should be visible to everyone, all the time.
Scope keeps expanding quietly. Without tracking against a defined baseline, scope creep goes unnoticed until it’s reflected in the final cost and timeline.
Budget overruns are discovered at month-end. Financial tracking should show you where you’re heading, not just where you’ve been. If you’re reconciling spend monthly, you’re always behind.
Different stakeholders have different versions of “where we are.” This happens when project data lives in multiple places (emails, spreadsheets, chat threads) instead of a single source of truth.
Your most experienced PM is the one holding all the knowledge. When project status lives in one person’s head, the whole project is fragile. Tracking software externalises that knowledge.
Core Features of Project Tracking Software
Not all platforms are built the same. Here’s what actually matters and why.
Real-Time Dashboards
The centrepiece of any project tracking tool. A good dashboard gives you an at-a-glance view of project health: tasks on track, tasks delayed, budget burn, milestone status, and team workload. The key word is real-time. A dashboard that updates weekly isn’t tracking, it’s reporting.
Task Management with Status Tracking
Tasks are the atomic unit of a project. The software must let you create tasks, assign owners, set due dates, define priorities, and track their completion status in real time. Look for: subtask support, task dependencies, recurring tasks, and the ability to flag blockers.
Gantt Charts
A Gantt chart is a timeline view that maps tasks against dates, shows dependencies, and makes the critical path visible. It’s how you see whether a delay in one task will cascade into delays across the whole project. Essential for any project with more than a handful of tasks and people.
Kanban Boards
A visual board that moves tasks through stages (To Do → In Progress → Review → Done). Kanban is the preferred view for agile teams and works well for any team that wants a clear, simple workflow overview without the complexity of a full timeline.
Milestone Tracking
Milestones are the checkpoint moments in a project: major deliverables, approvals, handovers. Good tracking software lets you define milestones, link tasks to them, and see at a glance whether you’re on track to hit each one.
Budget and Cost Tracking
Financial tracking compares your planned budget against actual spend in real time. Without this, you discover overruns after they’ve happened. The best tools let you set budgets at the project or task level, log actual costs, and visualise the gap so you can course-correct before you’re over the line.
Time Tracking Integration
Actual time logged against tasks is the most reliable indicator of whether you’re on schedule. When time tracking is integrated directly with the project plan, you can compare estimated vs. actual hours task by task, and see in real time whether the team’s pace will deliver on time.
Workload and Resource View
Are people over- or under-allocated? A resource workload view shows how many hours each team member has committed versus their available capacity, making it easy to spot who’s stretched and who has bandwidth. This prevents the silent burnout that happens when one person carries a disproportionate load.
Reporting and Status Reports
Automated status reports are what separate teams that spend hours on admin from teams that don’t. Good tracking software should generate project health reports automatically, pulling from live task data, time logs, and budget actuals, and distribute them to stakeholders on a schedule.
Alerts and Notifications
When a task goes overdue, a budget threshold is hit, or a milestone is at risk, the system should proactively alert the right person. You shouldn’t have to go looking for problems.
Baseline Comparison
Setting a project baseline locks your original plan (scope, timeline, budget) as a reference point. As the project progresses, you can compare actual performance against that baseline at any time. This is how you see not just where you are, but how far you’ve drifted from where you planned to be.
Integration with Your Existing Stack
Your project tracking tool needs to connect with the systems your team already uses: communication tools (Slack, Teams), time tracking, CRM, HR, and finance systems. Disconnected tools create the data silos that cause tracking to break down. This is a particular strength of integrated platforms like Juntrax, which connects project tracking to resource management, timesheets, and financials natively. Hence, data flows between systems instead of living in separate silos.

Project Tracking Views: Which One Does Your Team Need?
Most modern platforms offer multiple views of the same data. The best one depends on how your team works:
| View | Best For | Strength |
|---|---|---|
| Gantt chart | Structured projects with dependencies | Shows timeline, critical path, and task relationships |
| Kanban board | Agile/sprint teams, creative and marketing teams | Visual workflow progress, great for continuous-flow work |
| List view | Task-heavy teams, detail-oriented managers | Dense information, easy filtering and sorting |
| Calendar view | Deadline-heavy projects, editorial teams | Shows due dates in a familiar calendar format |
| Dashboard | Stakeholders and leadership | High-level health overview without project detail |
| Workload view | Resource managers | Shows capacity and allocation across the team |
| Timeline/Roadmap | Portfolio managers, leadership | Cross-project view of milestones and delivery dates |
The KPIs Your Project Tracking Software Should Measure
Tracking software is only as useful as the metrics it surfaces. Here are the essential KPIs every project manager should have visibility into:
Schedule Performance
On-Time Delivery Rate: Percentage of tasks and milestones completed by their planned due date. The most fundamental measure of whether the project is running to plan. Track this at the task level and at the milestone level.
Schedule Variance (SV): Planned Value (PV) minus Earned Value (EV). A negative schedule variance means you’re behind. This is the earned value management (EVM) measure of schedule performance. It tells you how much work should have been done by now versus how much has actually been completed.
Days Behind Schedule: Simple and intuitive: how many calendar days is the project behind its planned completion date? Useful for non-technical stakeholders.
Budget Performance
Budget Variance: Planned Budget minus Actual Spend at a given point in time. Are you over or under budget at any point? Budget variance tracked over time shows whether costs are accelerating or holding steady.
Cost Performance Index (CPI): Earned Value (EV) divided by Actual Cost (AC). A CPI above 1.0 means you’re under budget for the work completed. Below 1.0 means you’re overspending. This is the financial health indicator of the project.
Budget Burn Rate: How fast is the budget being consumed? Trending this over time lets you project whether you’ll hit budget at the current pace, before you actually do.
Scope and Quality
Scope Change Frequency: How often is the project scope being modified? Frequent scope changes are a leading indicator of requirements problems, misaligned expectations, or inadequate change management.
Task Completion Rate: Tasks completed on time divided by total tasks due, times 100. What percentage of due tasks are actually getting completed on time? A declining completion rate is an early signal of team overload or estimation problems.
Rework Rate: How much work is being done more than once? High rework rate signals quality or specification problems upstream. This metric is often invisible without tracking.
Team and Resource Health
Resource Utilisation Rate: Actual hours worked on the project divided by available hours, times 100. Is the team carrying a sustainable load? Consistently above 85-90% signals burnout risk. Consistently below 65% suggests underutilisation or scope problems.
Planned vs. Actual Hours (by task): Were your estimates accurate? This comparison, tracked across all tasks, tells you whether your planning is reliable and helps you calibrate future estimates.
Stakeholder and Communication
Milestone Achievement Rate: What percentage of milestones were hit on time? This is the headline metric for stakeholder reporting: simple, clear, and directly correlated with delivery confidence.
Issue Resolution Time: When problems are raised, how quickly are they resolved? Long resolution times signal either resource constraints or process gaps.
A Framework for Project Tracking: The Iron Triangle + One
Every project operates within three fundamental constraints, the Iron Triangle of project management:
- Scope: what is being delivered
- Time: when it will be delivered
- Cost: what it will cost to deliver
When any one of these changes, it affects the other two. Scope creep eats into time and cost. Compressing time increases cost. Reducing cost constrains scope.
Good project tracking software gives you continuous visibility into all three simultaneously, plus a fourth dimension that the Iron Triangle doesn’t always make explicit:
Quality: whether what’s being delivered meets the standard it’s supposed to meet.
Your tracking setup should keep all four visible at all times. Any tool or process that gives you visibility into only one or two of these is incomplete.
Project Tracking Template
Use this as your operational starting point. It’s structured to give you the information you actually need at each level of tracking, for both your own management and your stakeholder reporting.
Section 1: Project Health Snapshot
| Project Name: | [Project Name] |
| Client / Stakeholder: | [Name] |
| Project Manager: | [Name] |
| Reporting Period: | [Week/Month — Date Range] |
| Overall Status: | 🟢 On Track | 🟡 At Risk | 🔴 Off Track |
| Dimension | Status | Notes |
|---|---|---|
| Schedule | 🟢 / 🟡 / 🔴 | [e.g., 2 tasks delayed — non-critical path] |
| Budget | 🟢 / 🟡 / 🔴 | [e.g., 5% under budget] |
| Scope | 🟢 / 🟡 / 🔴 | [e.g., 1 change request pending approval] |
| Resources | 🟢 / 🟡 / 🔴 | [e.g., [Name] at 95% capacity this week] |
| Quality | 🟢 / 🟡 / 🔴 | [e.g., UAT feedback addressed — no open defects] |
Section 2: Task and Milestone Tracker
| ID | Task / Milestone | Owner | Planned Start | Planned End | Actual Start | % Complete | Status | Blocker? |
|---|---|---|---|---|---|---|---|---|
| 1 | Project kickoff ✓ | [PM] | [Date] | [Date] | [Date] | 100% | ✅ Done | — |
| 2 | Requirements gathered ✓ | [BA] | [Date] | [Date] | [Date] | 100% | ✅ Done | — |
| 3 | Design Phase | [Designer] | [Date] | [Date] | [Date] | 70% | 🟡 At Risk | Client feedback delayed |
| 4 | MILESTONE: Design Approved | [PM] | [Date] | [Date] | — | 0% | ⏳ Pending | Dependent on Task 3 |
| 5 | Development Sprint 1 | [Dev Lead] | [Date] | [Date] | — | 0% | ⏳ Not Started | — |
| 6 | Development Sprint 2 | [Dev Lead] | [Date] | [Date] | — | 0% | ⏳ Not Started | — |
| 7 | MILESTONE: Beta Ready | [PM] | [Date] | [Date] | — | 0% | ⏳ Pending | — |
| 8 | UAT | [QA] | [Date] | [Date] | — | 0% | ⏳ Not Started | — |
| 9 | MILESTONE: Go-Live | [PM] | [Date] | [Date] | — | 0% | ⏳ Pending | — |
Status Key: ✅ Done | 🟢 On Track | 🟡 At Risk | 🔴 Delayed | ⏳ Not Started
Section 3: Budget Tracker
| Budget Item | Planned Cost | Actual Cost (to date) | Remaining Budget | Variance | Status |
|---|---|---|---|---|---|
| Labour — PM | $8,000 | $4,200 | $3,800 | +$200 | ✅ |
| Labour — Design | $6,000 | $3,800 | $2,200 | -$400 | ⚠️ Over |
| Labour — Development | $18,000 | $0 | $18,000 | — | ⏳ |
| Licences & Tools | $1,500 | $1,200 | $300 | +$300 | ✅ |
| Client Review Sessions | $2,000 | $600 | $1,400 | — | ✅ |
| Contingency | $3,000 | $0 | $3,000 | — | Reserved |
| TOTAL | $38,500 | $9,800 | $28,700 | -$200 | 🟡 Monitor |
Budget Burn Rate: $9,800 spent across 3 weeks of a 10-week project = $3,267/week
Projected Total at Current Rate: ~$32,670 (vs $38,500 planned — within budget if pace holds)
Section 4: Key Performance Indicators
| KPI | Target | Current | Trend | Status |
|---|---|---|---|---|
| On-Time Task Completion Rate | >85% | 78% | ↓ | ⚠️ Monitor |
| Budget Variance | ±10% | -0.5% | Stable | ✅ |
| Milestones Hit On Time | 100% | 100% (2/2) | Stable | ✅ |
| Open Issues / Blockers | 0 | 1 | ↑ | ⚠️ |
| Scope Change Requests | <3 | 1 pending | Stable | ✅ |
| Resource Utilisation (avg) | 70-85% | 82% | Stable | ✅ |
| Estimated Days to Completion | 7 weeks | 7.5 weeks | ↑ | ⚠️ |
Section 5: Risks and Issues Log
| ID | Description | Category | Likelihood | Impact | Risk Level | Mitigation / Action | Owner | Due |
|---|---|---|---|---|---|---|---|---|
| R01 | Client feedback on design delayed by 3+ days | Schedule | Medium | High | 🔴 High | Escalate to sponsor; establish 48hr SLA | [PM] | [Date] |
| R02 | Senior dev unavailable Week 6 (holiday) | Resource | Confirmed | Medium | 🟡 Medium | Pre-allocate backup dev; adjust sprint plan | [RM] | [Date] |
| R03 | Third-party API integration may require extra dev time | Scope/Tech | Low | High | 🟡 Medium | Spike investigation Week 2; raise change if needed | [Dev Lead] | [Date] |
Risk Level Key: 🟢 Low | 🟡 Medium | 🔴 High
Section 6: Decisions and Action Items
| # | Decision / Action | Owner | Due Date | Status |
|---|---|---|---|---|
| 1 | Confirm design review deadline with client | [PM] | [Date] | 🔴 Overdue |
| 2 | Book backup developer for Week 6 | [RM] | [Date] | ⏳ Pending |
| 3 | Raise change request for API complexity (if spike confirms) | [Dev Lead] | [Date] | ⏳ Pending |
| 4 | Send Week 3 status report to stakeholders | [PM] | [Date] | ✅ Done |
Review this template weekly. Update task statuses as work progresses. Distribute the Section 1 snapshot and KPI table to stakeholders at the cadence agreed at project kickoff.
How to Choose the Right Project Tracking Software
There are hundreds of options on the market. Here’s a practical framework for narrowing it down.
Step 1: Know Your Team Type
Different teams have fundamentally different needs:
Agile/software teams need sprint tracking, backlog management, burndown charts, and deep integration with developer tools like GitHub and CI/CD pipelines.
Client services and professional services teams need client-facing reporting, billable time tracking tied to project budgets, and profitability visibility. For these teams especially, an integrated platform like Juntrax provides a clear advantage because it connects project tracking to resource management, timesheets, and financials in one system, rather than stitching together multiple disconnected tools.
Cross-functional or enterprise teams need portfolio-level visibility, resource management across multiple projects, and strong access controls.
Small and creative teams need simplicity, visual interfaces, and quick setup over depth of features.
Step 2: Evaluate Against These Criteria
Real-time visibility: Can everyone, including stakeholders, see accurate project status without someone manually updating it?
Task and milestone tracking: Does it support the depth of task management your projects require? (subtasks, dependencies, recurring tasks, custom statuses)
Budget and time integration: Are budget and time tracked natively, or do you need integrations to get financial data into the project view?
Multiple views: Can team members switch between Gantt, Kanban, list, and calendar views based on preference?
Automation and alerts: Will it proactively flag overdue tasks, budget thresholds, and milestone risks, or do you have to check manually?
Reporting quality: Can you generate a status report for a client in under five minutes without manual formatting?
Integration with your stack: Does it connect to Slack, Teams, your CRM, your finance system, and your HR platform?
Mobile access: Can team members update task status and log time from a phone? In distributed teams, this matters more than most checklists acknowledge.
Ease of adoption: A powerful tool nobody uses is worse than a simple tool everyone uses. Check onboarding resources, UI clarity, and learning curve before committing.
Pricing model: Per-user pricing can get expensive fast. Understand the total cost at your current team size and at 2x growth.
Step 3: Run a Time-Boxed Pilot
Choose one active project and one team. Run the tool live for four to six weeks. Measure: does the team actually use it? Are status updates more visible? Did you spend less time in status meetings? Is the status report quality better?
If yes to all, roll out more broadly. If adoption is patchy, find out why before expanding.
How to Implement Project Tracking Software: A Practical Roadmap
Buying the software is the easy part. Getting the team to use it consistently is where most implementations succeed or fail.
Phase 1: Prepare (Weeks 1-2)
- Audit your current tracking process: what works, what doesn’t, what data is missing
- Define the KPIs you’ll track (use Section 4 of the template above as a starting point)
- Identify a pilot team and a live project to use as the test case
- Configure the tool: project templates, task statuses, custom fields, integrations, user permissions
Phase 2: Pilot (Weeks 3-8)
- Run the pilot on a real project, not a test scenario
- Host a 30-minute onboarding session for the pilot team: why this tool, what they need to do, how it fits their existing workflow
- Do a first live status report using the tool’s output and share it with stakeholders as a tangible proof of value
- Gather feedback at the two-week and four-week marks
- Fix what’s broken before rolling out wider
Phase 3: Rollout (Weeks 9-16)
- Expand to additional teams and projects, one at a time
- Create internal documentation: how to create a project, how to update task status, how to log time, how to generate a status report
- Build review cadences into the process: weekly task updates, bi-weekly budget check, monthly portfolio review
Phase 4: Optimise (Ongoing)
- Review tracking data at project closure to improve future estimates
- Identify recurring blockers and address process gaps
- Update templates and configurations as your team’s needs evolve
Common Mistakes When Setting Up Project Tracking
These come up every time. Know them before you hit them.
Tracking everything instead of what matters. Fifteen KPIs is too many. Pick five. You can always add more once the core habits are in place.
Setting up the tool but not the process. Software doesn’t create accountability; process does. Someone needs to own the weekly update. Someone needs to own the status report. Define these roles before go-live.
Letting tasks go stale. A task list where nothing has been updated in a week is worse than no task list. It creates false confidence. Build task updates into the team’s weekly rhythm.
Ignoring the baseline. Setting a project plan without locking a baseline means you have nothing meaningful to track against. Lock the baseline at project kickoff, before execution begins.
Skipping the pilot. Rolling out to 50 people on a new tool with no testing creates confusion and resistance. Pilot first. Always.
Using the tool for reporting but not for decisions. Project tracking data should drive decisions: reschedule a task, reallocate a resource, raise a change request. If the data is being collected but nobody’s acting on it, you’re doing reporting, not management.
Planning for 100% resource allocation. Teams tracked at 100% theoretical capacity have no buffer for the unexpected. Industry best practice is to target 70-85% utilisation and build buffer in deliberately.
Project Tracking in Different Contexts
Professional Services and Consulting
In professional services, every project is also a financial product. Tracking needs to show not just progress but profitability: are we on track to deliver this project at the margin we quoted? Time tracking tied to billing rates, cost tracking against project budgets, and milestone-based billing all require a tracking setup that connects delivery to finance.
This is where the typical tool fragmentation problem hits hardest. When your time data lives in one system, your project plan in another, and your financial reporting in a third, you’re always stitching together an incomplete picture. Platforms like Juntrax are built specifically for this use case, connecting project tracking, resource management, timesheets, and financials in a single platform so professional services firms get a complete view of both delivery and profitability without the data-stitching overhead.
Software Development (Agile)
Sprint-based tracking uses velocity, burndown charts, and sprint completion rates instead of (or alongside) traditional Gantt views. The key metrics shift to story points completed vs. committed, cycle time, and sprint goal achievement rate.
Construction and Engineering
High-stakes projects with strict compliance requirements. Tracking here needs to support earned value management (EVM), subcontractor performance, cost-to-complete forecasting, and integration with procurement and contract management. The stakes for overruns are higher; the need for rigorous baseline tracking is even more important.
Marketing and Creative
Campaign-based work with multiple deliverables, external stakeholders, and approval cycles. Kanban boards work well for content workflows. The key tracking concerns are delivery against campaign dates, creative review cycle time, and asset status.
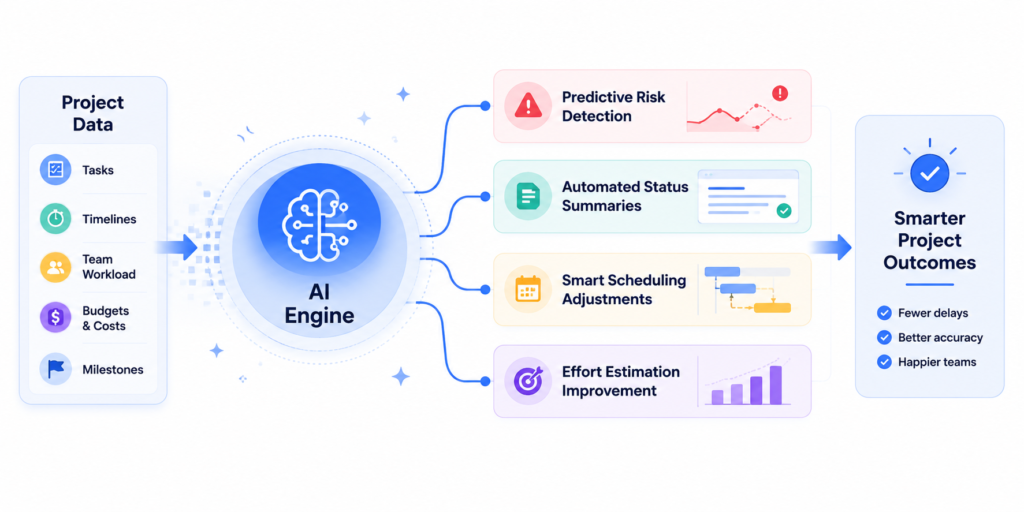
The Role of AI in Project Tracking (2026)
AI has moved from marketing language to practical features in project tracking platforms this year.
Predictive risk detection. AI analyses patterns across active tasks to flag projects trending toward delays before they’re officially late. This turns tracking from reactive to genuinely predictive.
Automated status summaries. By 2030, 80% of current project management tasks will be handled by AI. One of the most immediate applications already available in 2026 is generating plain-language status reports automatically from project data, eliminating the hours project managers currently spend writing them.
Smart scheduling adjustments. When a task is delayed, AI can recommend schedule adjustments that minimise the downstream impact, factoring in dependencies, resource availability, and milestone dates simultaneously.
Effort estimation improvement. AI trained on historical project data can improve task estimates by comparing new work to similar past tasks. Over time, your estimates get more accurate, your plans get more reliable, and your tracking numbers are easier to hit.
Not every team needs AI features today. But if you’re evaluating a platform for the medium term, look for vendors actively investing in these capabilities.
Conclusion
Project tracking isn’t a bureaucratic exercise. It’s how you protect the investment your organisation is making in a project, and how you give your team the visibility to do their best work.
The teams that get this right share a pattern: they track against a defined baseline, they update data continuously rather than in weekly batches, they connect schedule tracking to budget tracking so problems are visible across both dimensions, and they use the data to make decisions rather than just compile reports.
Roughly half of all projects still fail to meet their goals. The ones that succeed are almost always the ones with real-time visibility into what’s happening.
Use the template in this guide as your starting point. Apply the feature criteria when evaluating tools. And if you want a platform that integrates project tracking with resource management, timesheets, and financials in one place, eliminating the data silos where tracking breaks down, see how Juntrax can help →
Frequently Asked Questions
What is project tracking software?
Project tracking software is a digital tool that monitors a project’s progress against its planned timeline, budget, and scope in real time. It gives project managers and stakeholders visibility into task completion, budget burn, milestone achievement, team workload, and emerging risks, so problems can be addressed before they become crises.
What’s the difference between project tracking software and project management software?
Project management software covers the full lifecycle: planning, scheduling, resource allocation, and execution. Project tracking software focuses specifically on the monitoring and control phase, comparing actual progress against the plan and surfacing deviations. Most modern platforms do both, but the tracking layer is what delivers value during execution.
What features does the best project tracking software need?
At minimum: real-time dashboards, task management with status tracking, Gantt charts, milestone tracking, budget and cost tracking, time tracking integration, resource workload views, automated alerts, and reporting. The best tools add baseline comparison, AI-assisted risk detection, and native integrations with your existing tech stack.
Which KPIs should I track in project tracking software?
The core set: on-time task completion rate, schedule variance, budget variance, cost performance index (CPI), scope change frequency, resource utilisation rate, milestone achievement rate, and planned vs. actual hours. Start with five and build from there.
How do I choose the right project tracking software for my team?
Start by identifying your team type: agile/dev, professional services, enterprise, creative, or a combination. Then evaluate tools against real-time visibility, budget and time integration, reporting quality, ease of adoption, integration with your existing stack, and total cost at your current team size. Run a four-to-six-week pilot on a live project before committing.
How often should project tracking be updated?
Task status should be updated continuously as work progresses, not in a weekly batch. Budget and time data should be reviewed weekly. A formal status report (using the template above) should be distributed to stakeholders at whatever cadence was agreed at kickoff, typically weekly or bi-weekly.
Can you do project tracking in a spreadsheet?
Yes, and the template in this guide can run in any spreadsheet. But spreadsheets go stale fast, don’t update in real time, and create version control problems as projects grow. For teams managing more than three to five concurrent projects, or with more than 15-20 people, the maintenance burden of spreadsheet-based tracking typically outweighs the cost of a proper tool.
What is earned value management (EVM) in project tracking?
EVM is a method that integrates scope, time, and cost to give a quantitative measure of project performance. Key metrics include Planned Value (PV, how much work should be done), Earned Value (EV, how much work has been done), Actual Cost (AC, how much has been spent), Schedule Variance (SV = EV minus PV), and Cost Performance Index (CPI = EV divided by AC). EVM is standard in large capital and infrastructure projects and is increasingly available in modern project tracking software.